Eurovision Voting Blocs
Detecting Bias In the Eurovision
Adam Price
June 9th 2020
For a long time, the Eurovision Song contest has been accused of political voting. Voting pairs like Greece and Cyprus or Sweden and Denmark are well known but does this bias go deeper? Can we identify entire voting blocs in the contest?
The competition does attempt to offset political voting by using an impartial jury to hand out half of each nations points, however, Since 2014, the Eurovision song contest has been releasing the televoting rankings of each nation. Now that this dataset has grown, we have a unique opportunity to identify national bias within the Eurovision watching population of Europe.
Before we can get started, we need a dataset. A lot of the relevant data can be found here. However, it is missing a couple of years of televoting, so see my Github repository for the data I used and to view the code I created for this post.
With data in hand, I can walk you through the preprocessing steps I decided to use:
- The point values given to a nation are divided by the total number of points the nation received that year. Nations in a voting bloc will vote for each other regardless of the song quality. So, in years where a nation’s song is ranked poorly overall, their voting bloc will stand out as a large proportion of their points.
- The point values 12 and 10 were changed to 10 and 9, respectively. This removes the weighting towards ranks 1st and 2nd.
- Only data from the finals is used.
- Nations who received no points in the finals were removed.
I compiled the data into a 2D matrix by averaging the proportions of points given to each nation each year. Years in which a nation could not be given points because they didn’t qualify for the final were ignored.
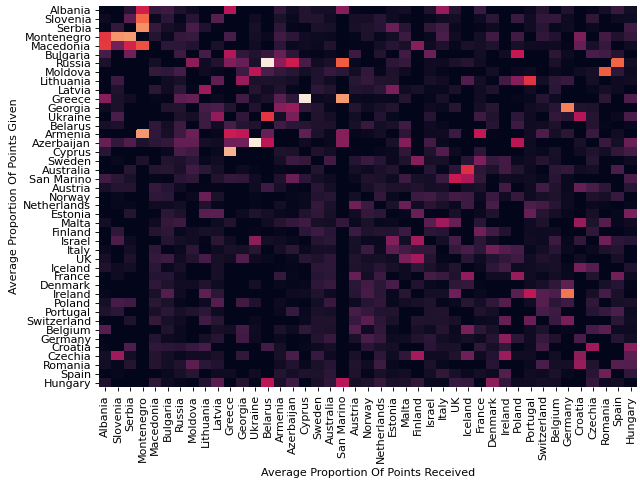
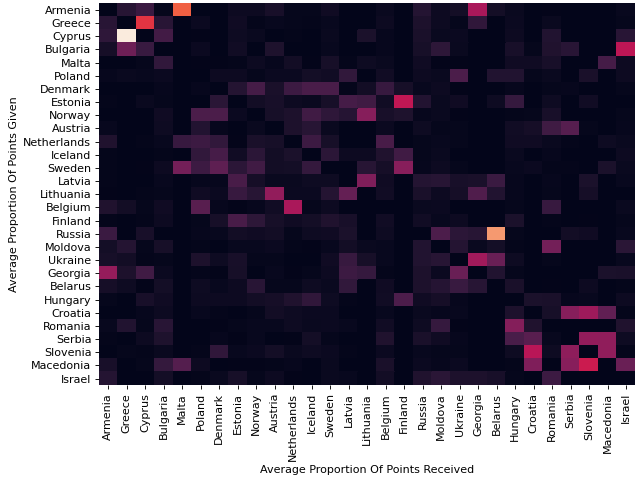
The matrix can be seen as a weighted bi-directional network between all the nations. This lets us use the Louvain Method for community detection to separate all the nations into voting blocs. When the blocs are ordered together we get this heatmap:
We can see a few square regions of high activation. These areas are the different voting blocks.
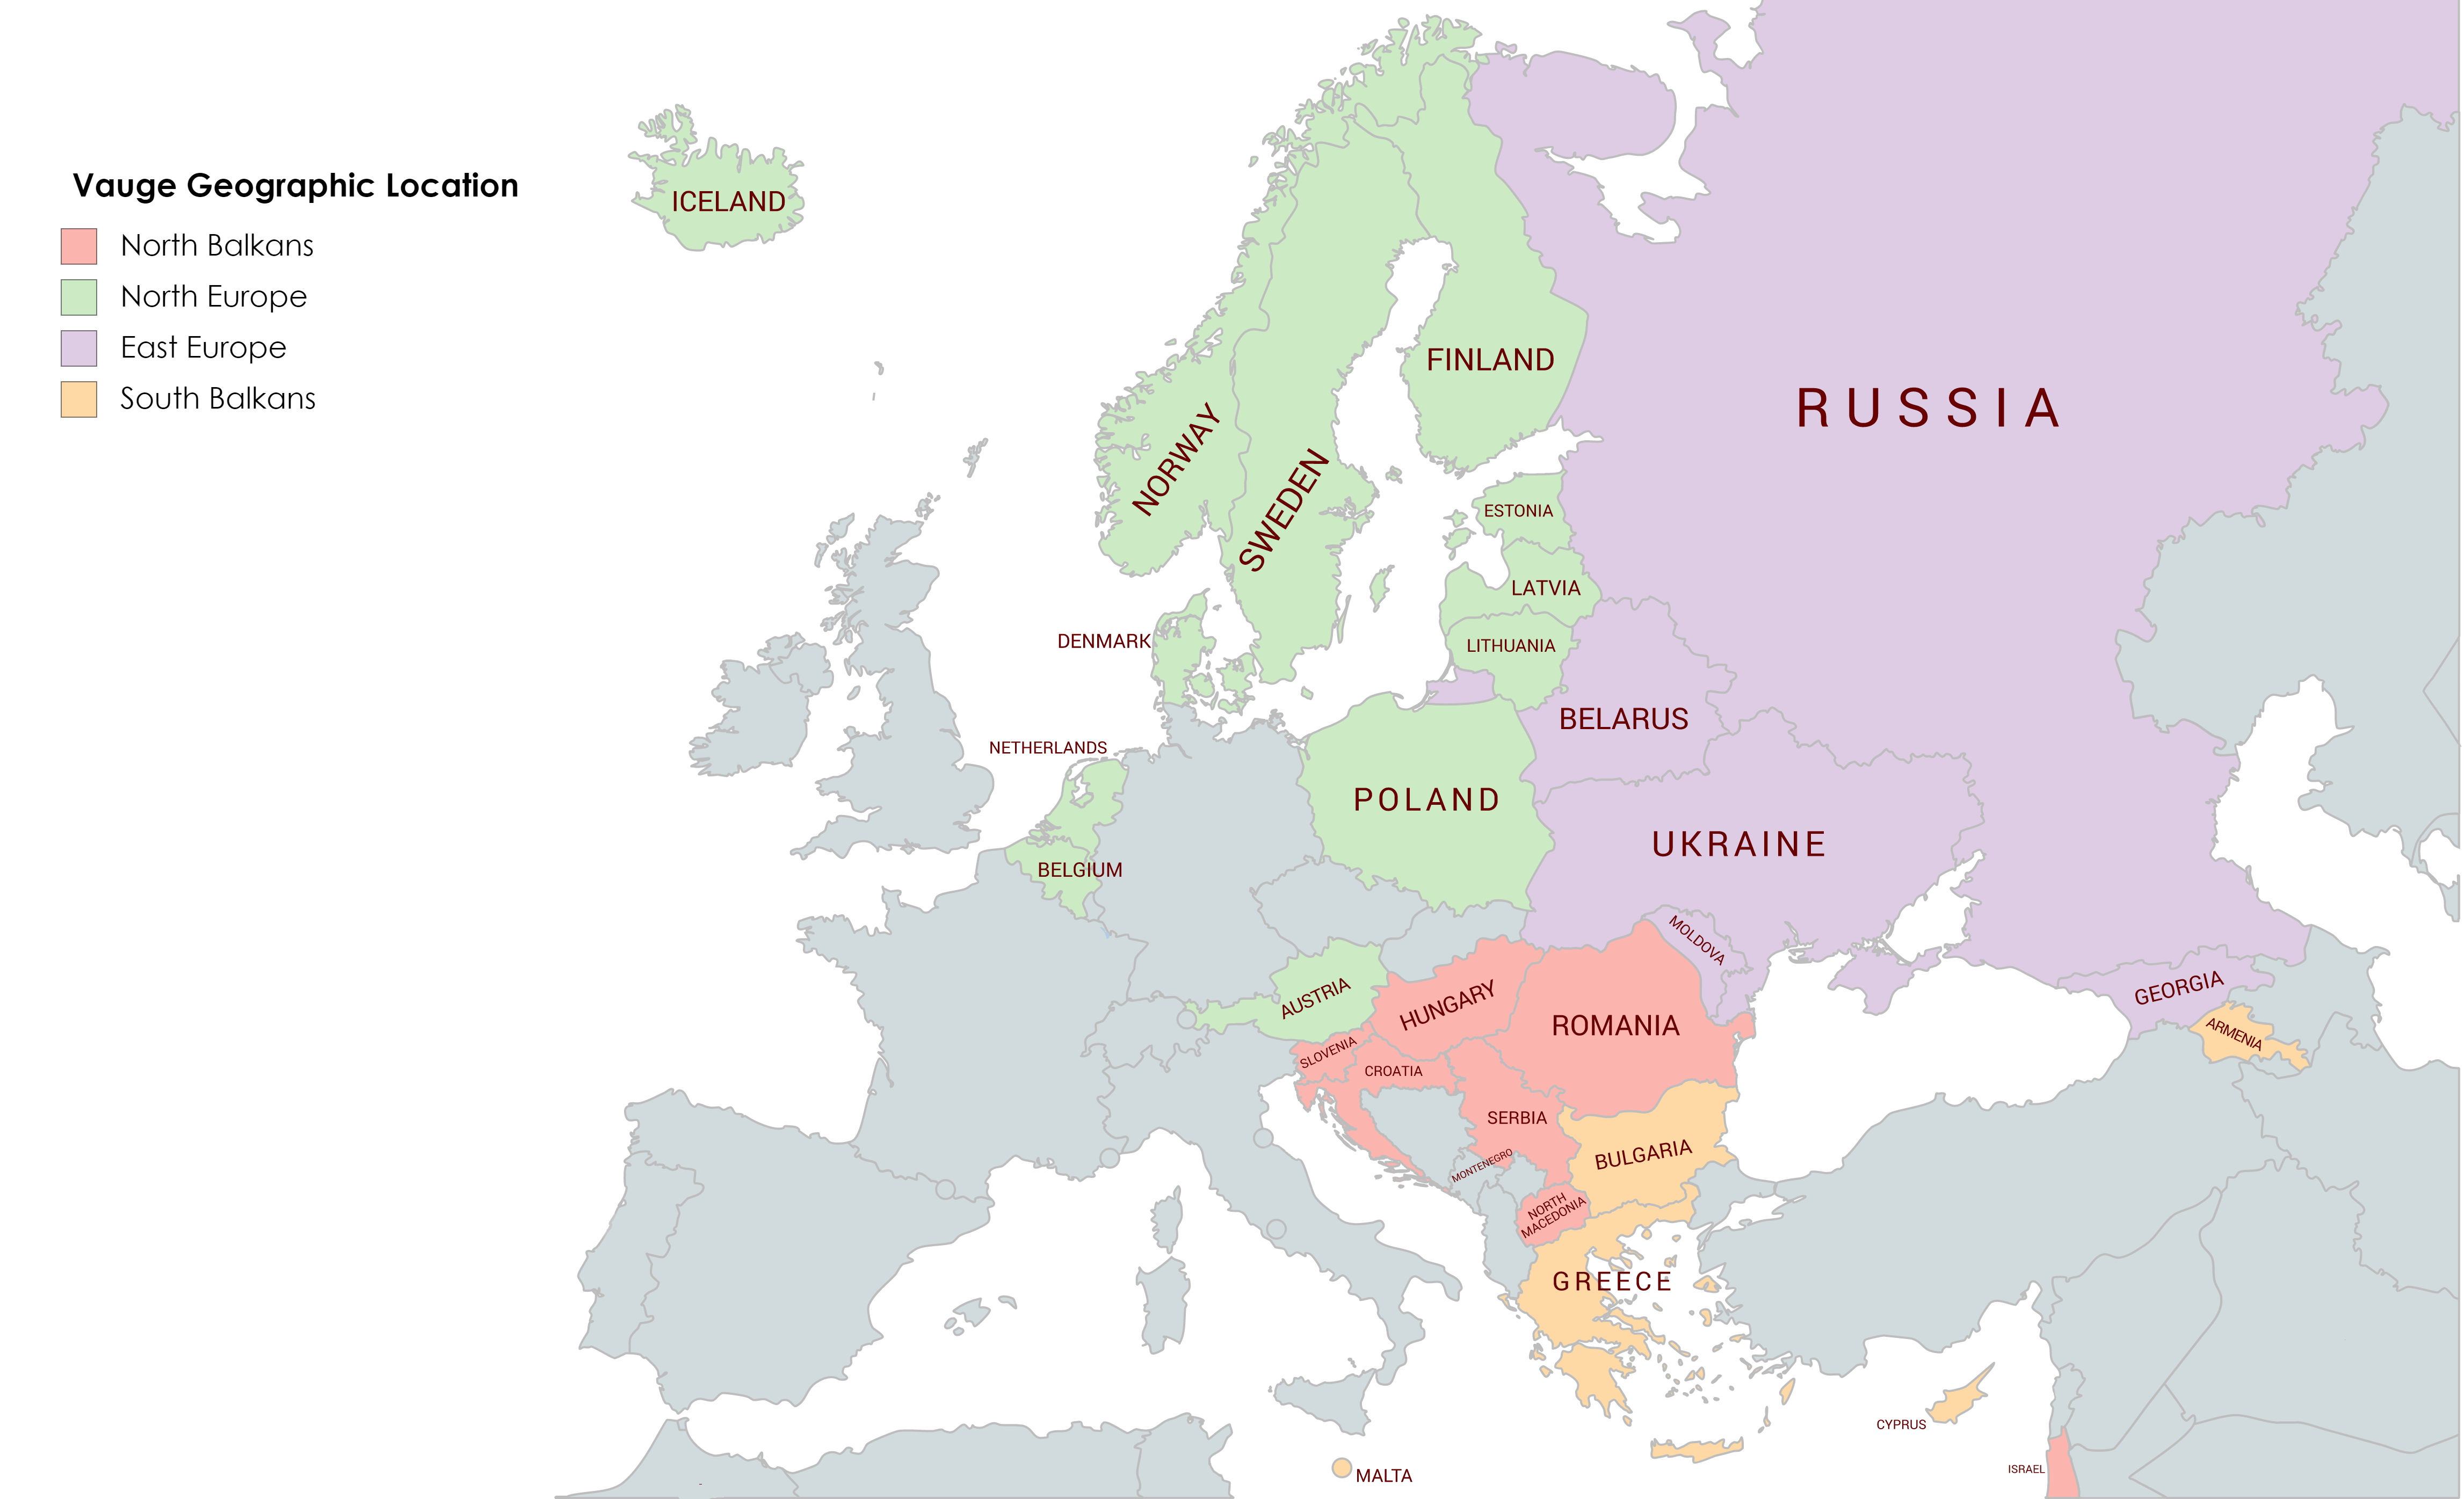
Translating this onto a map of Europe, we get this:
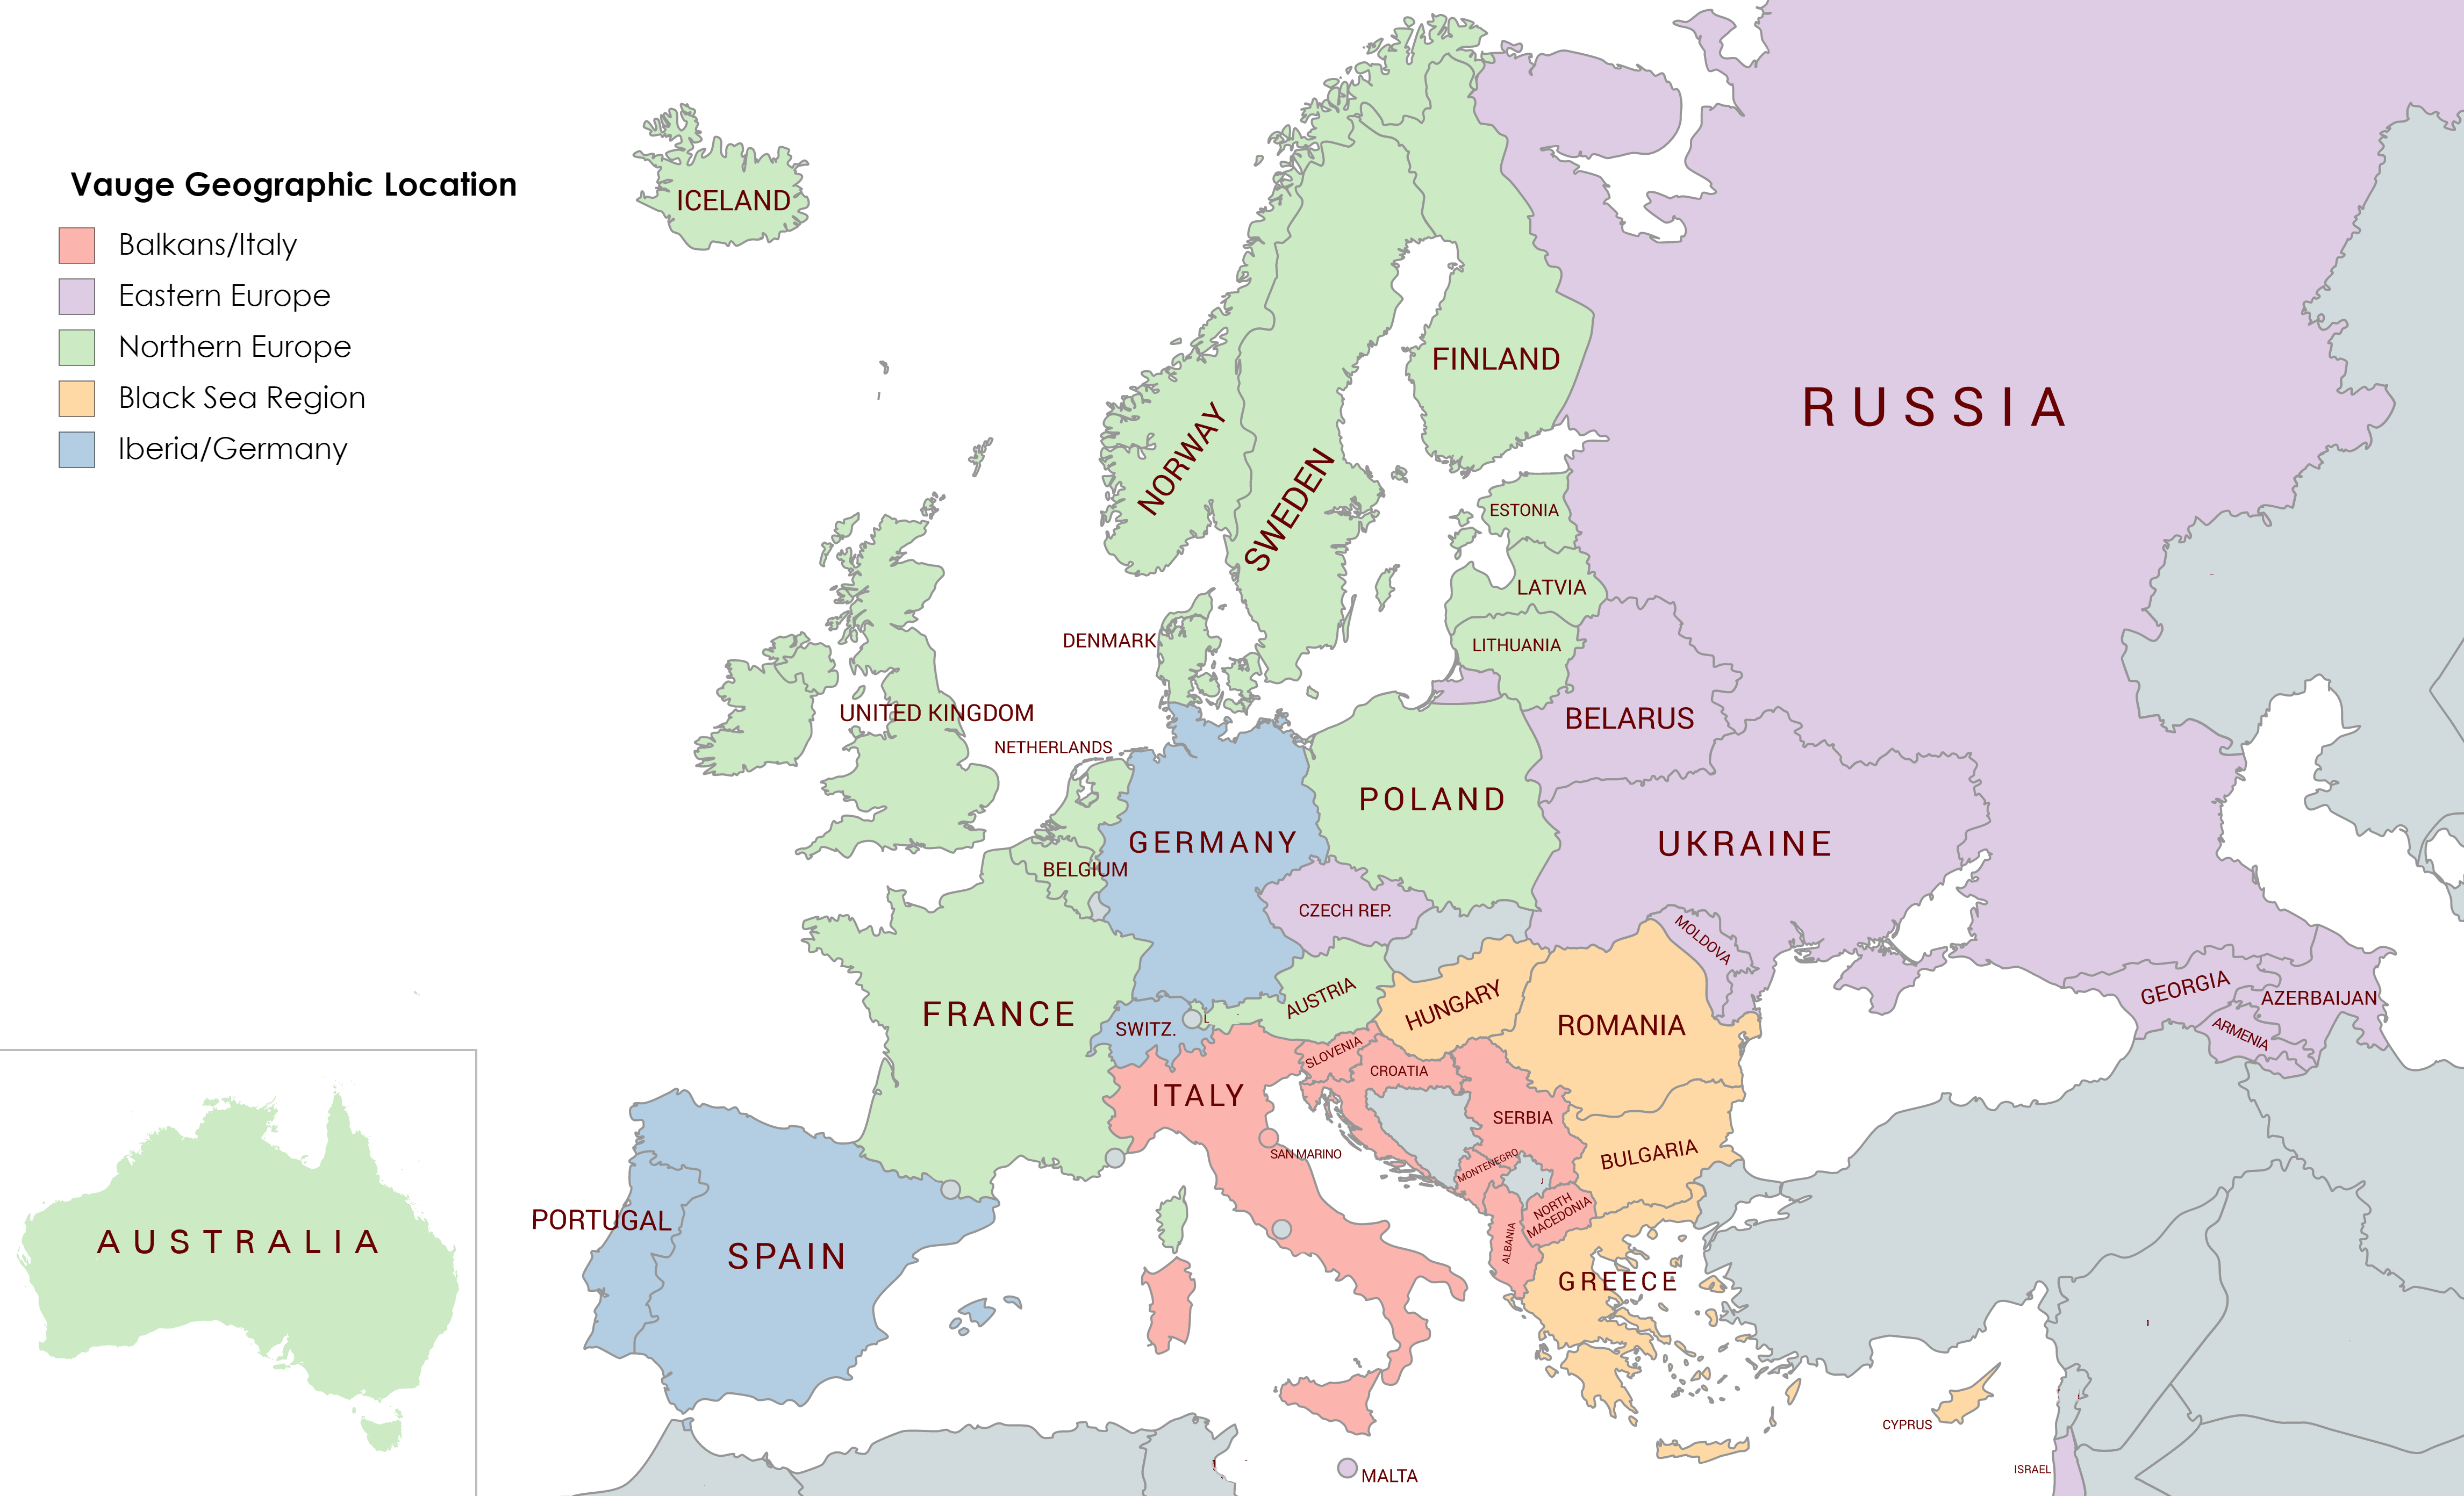
In general, the voting blocs reflect geographic and cultural borders, for example, Russian influence in the Eastern European bloc or the ex-Yugoslavian nations. However, as we move west, the blocs become larger and less defined.
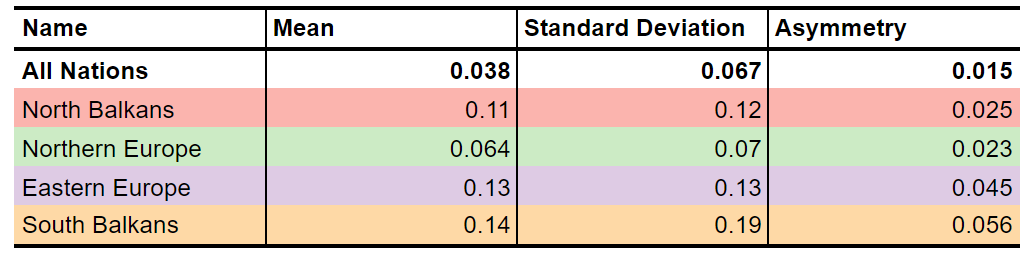
This table gives us a bit more detail about the voting blocs:
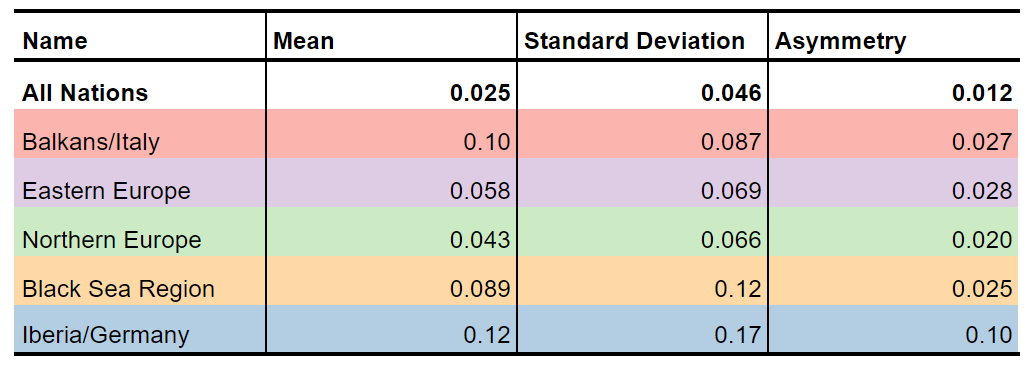
Not all the voting blocs are made equal. The regional bias in the ‘Northern Europe’ bloc, while above the mean across all nations, is far lower than seen in other areas.
The ‘Asymmetry’ metric tells us how reflected points given and received are. ‘Asymmetry’ of 0 would imply that a nation gives back the same points that it receives from a nation. Blocs with high Asymmetry are poor examples of voting blocs. If we Look at the geography of the Iberia/Germany bloc, it isn’t too surprising that isn’t a strong voting bloc.
This highlights an issue with trying to fit all nations into blocs. Some nations have very high measures of asymmetry. They don’t give points back to the nations that give them points. By forcing these nations into voting blocs, we add a lot of noise to the clustering which, in turn, adds a lot of uncertainty to the blocs that we have found.
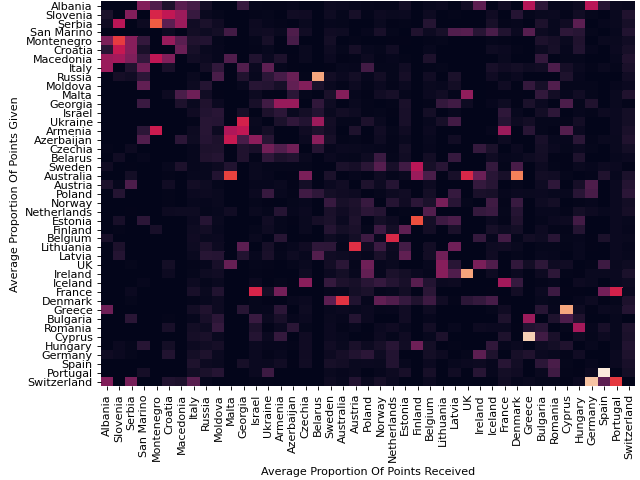
To address this, I repeated all the steps to produce the first heatmap, but this time I removed the 15 most asymmetric nations.
Interestingly, the big 5 and Australia are in these 15 nations. These nations do not need to qualify for the final through competing in the semi-finals. This could tell us that nations in voting blocs are more likely to get through the semi-finals.
With the asymmetric nations removed, we get a heatmap that looks like this:
These clusters already appear to be more defined than before and our metrics do back this up:
This has updated the map a fair amount:
So, we have found the voting blocs! I am quite surprised at the extent of geographic bias in the competition. There is no denying that a large proportion of points that nations receive comes from their voting blocs. But, does it play a large enough role to affect winning songs? Take a look at this table of the winning songs for the last 6 Eurovision.
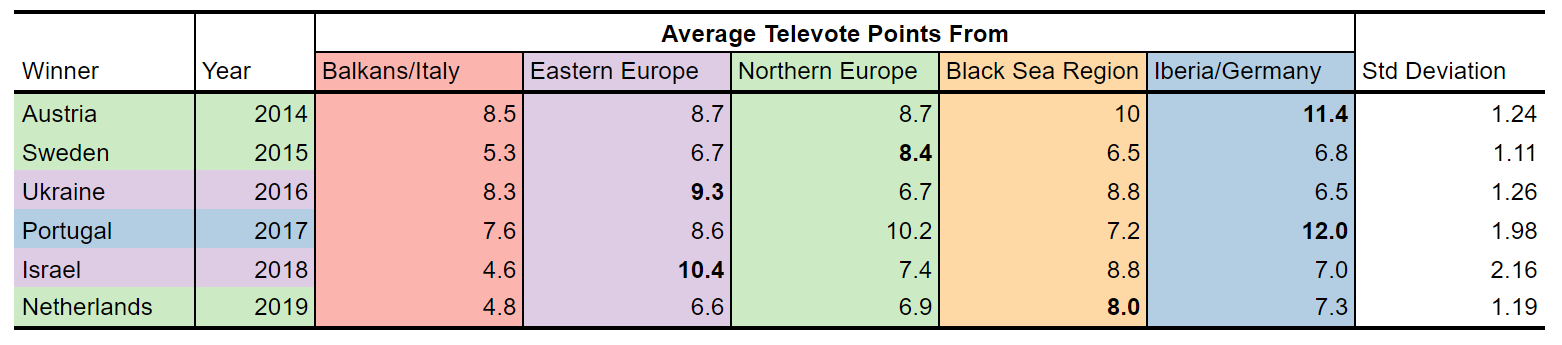
In general, we see strong support from winning songs own bloc. Also, (ignoring the Balkans), winning songs do manage to rank highly across the other voting blocs. But, it would be hard to claim that all the blocs complete agree on the winning song.
Voting blocs are a natural emergent of the Eurovision’s voting system, and although it seems that little can be done to prevent voting blocs, it would be possible to minimise their impact. Currently, nations give 12 points to the most voted for song and 10 to second. This gives an additional weighting to the top 2 songs from each countries vote, a factor that could be exploited in voting blocs. I have recreated the previous table, but this time 12 point votes have been reduced to 10 and 10 points to 9.
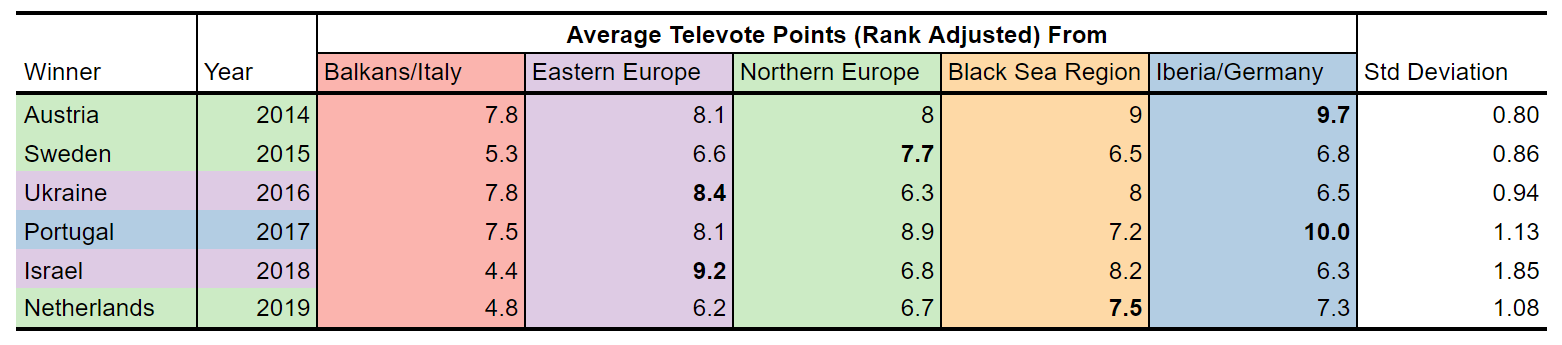
The standard deviation has been reduced from an average of 1.49 to 1.11 — the bias has been minimised. I wasn’t able to find a reason for the 12 points system being introduced to the contest. However, it seems clear, both intuitively and evidently, that it allows bias to be further exploited. Perhaps the change is worth it though. Simply for entertainment’s sake. After all, it is a singing contest.
As a closing note, I think it is worth mentioning that the judge voting appears to have less bias. It is far from perfect, but reassuring that the professionals are more objective than the public.